-1.png?height=120&name=formrun_logo%20(3)-1.png)
Information about the items that can be aggregated and how to display the aggregation.
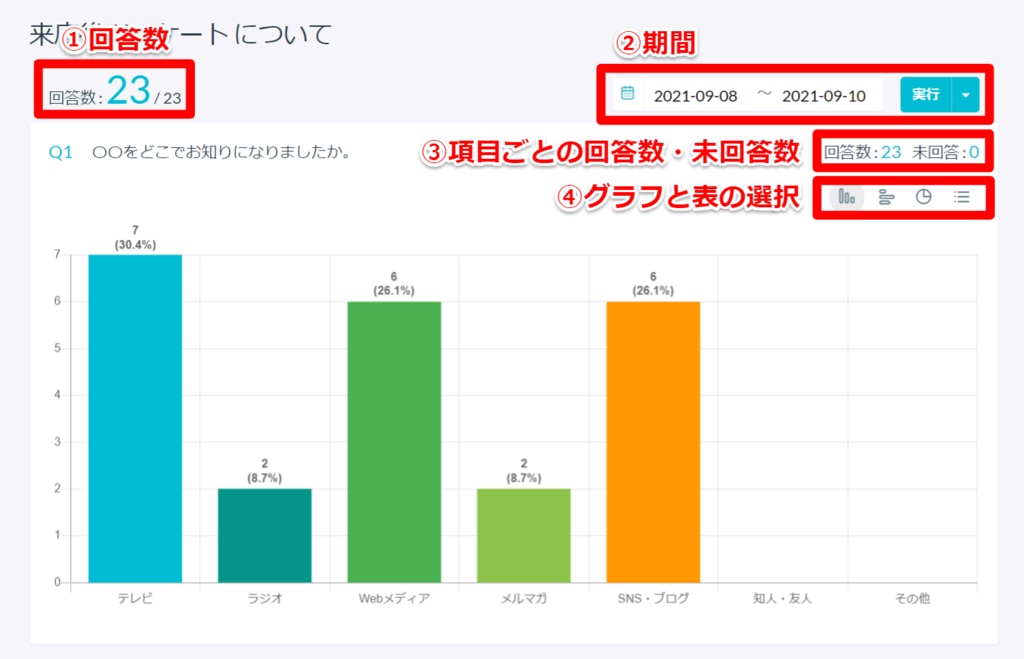
【①Submissions】
This displays the number of submissions after the release of this feature.
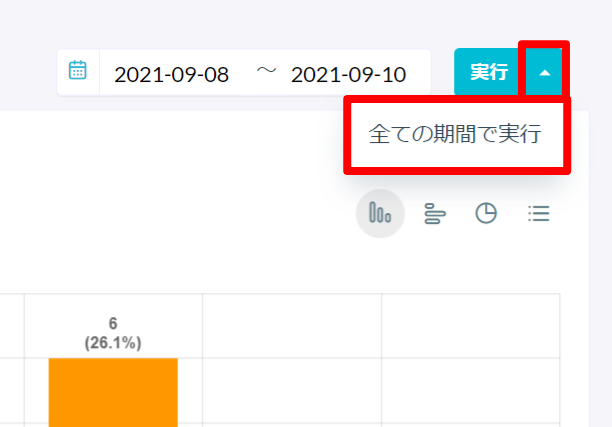
【②Duration】
You can specify the period of the submissions you want to aggregate and view them.
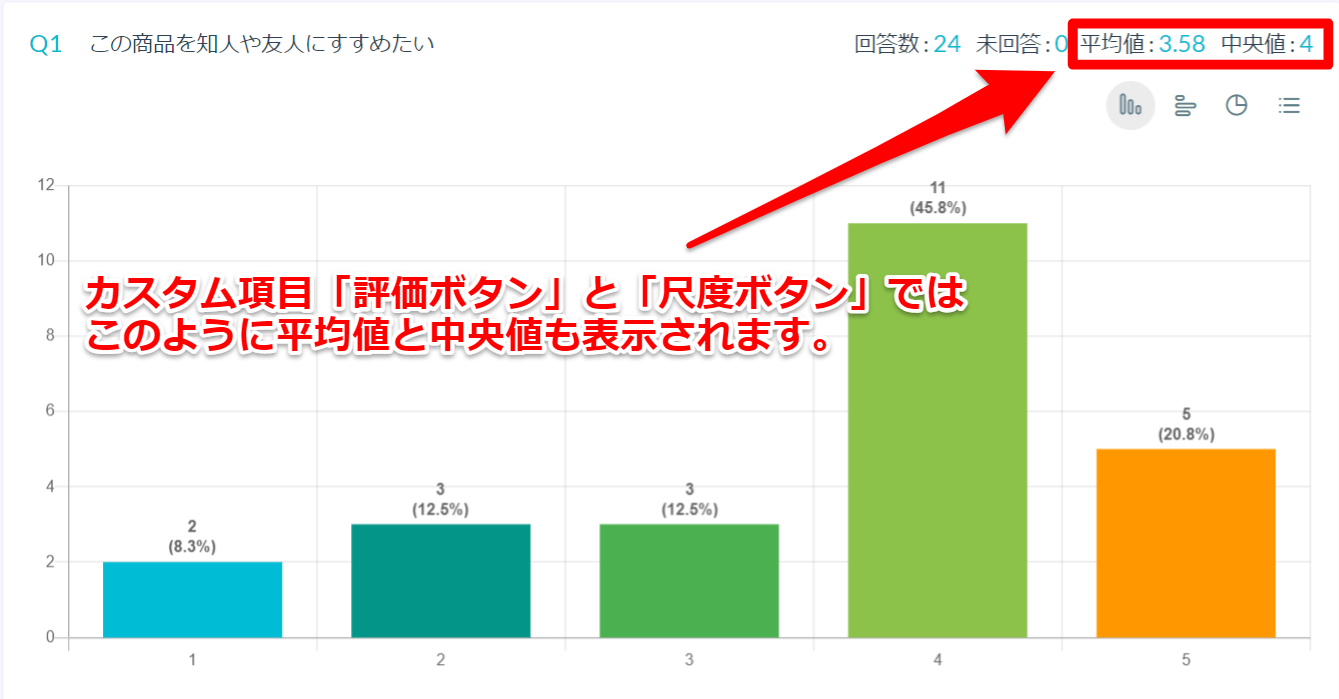
【③Number of submissions & unanswered by fields】
Displays the number of submissions and unanswered for each field set up in the form.
Note, for custom fields "Rating Button" and "Scale Button", the average and median values are also displayed.
【④Graph & List Selection】
About Graph
In the submission aggregation feature, you can switch to the graph indicated by "○" in the table below and check the aggregated results.
Fields not listed below are "List display" only.
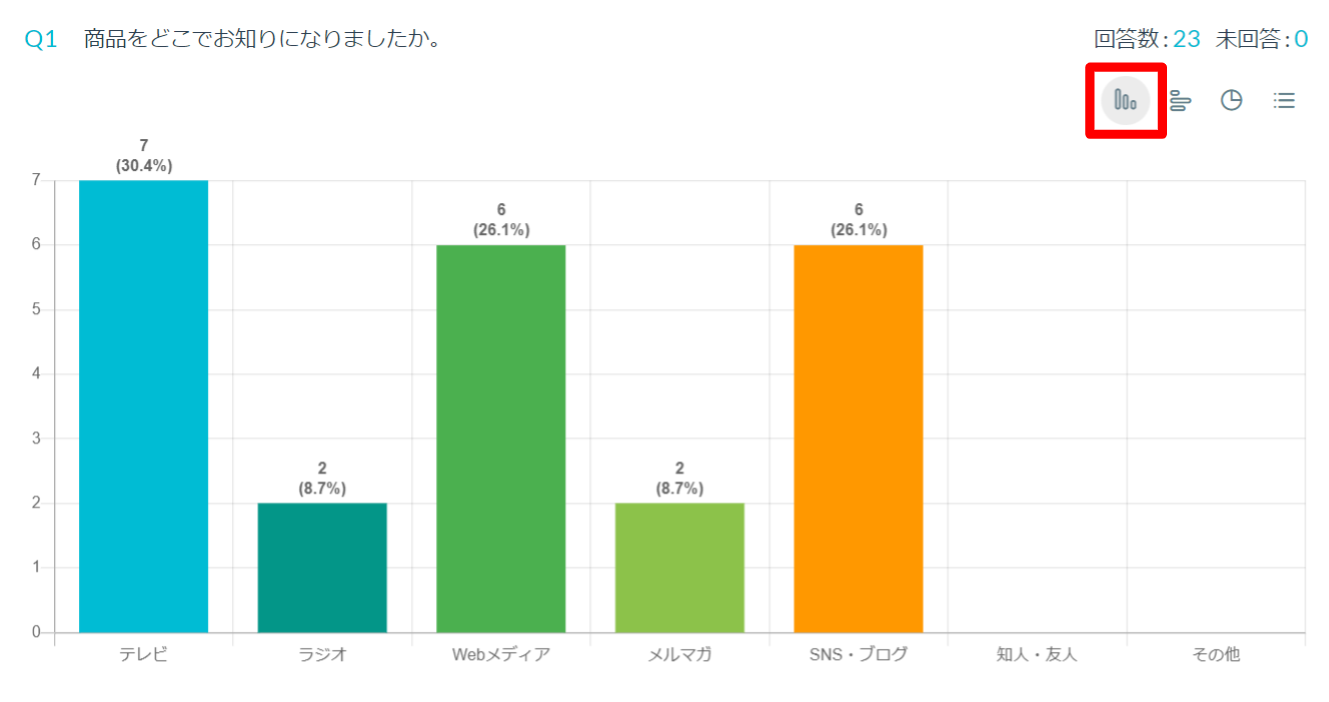
The specifications for the vertical bar chart are as follows:
- Actual numbers are displayed at the top of the graph
- The vertical axis varies based on the number of submissions
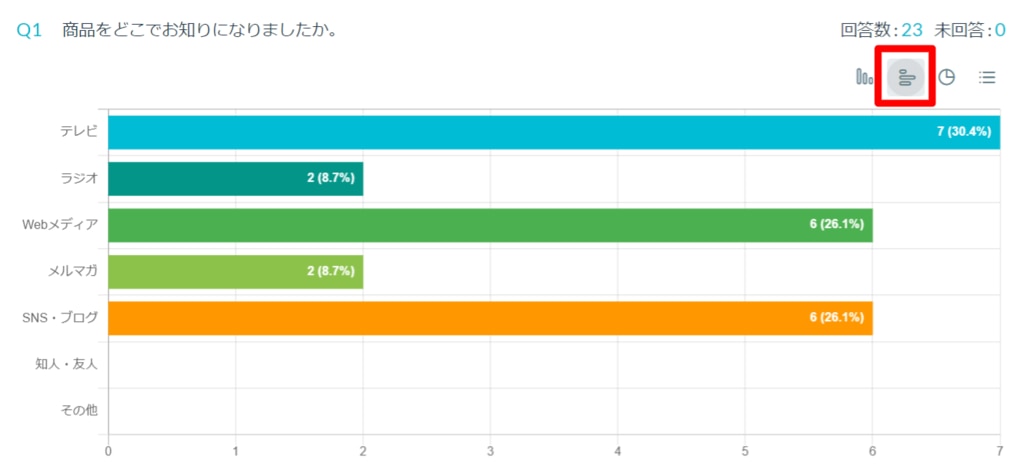
In the bar chart, the following specifications apply:
- Actual numbers are displayed on the right side of the graph
- The horizontal axis varies based on the number of submissions
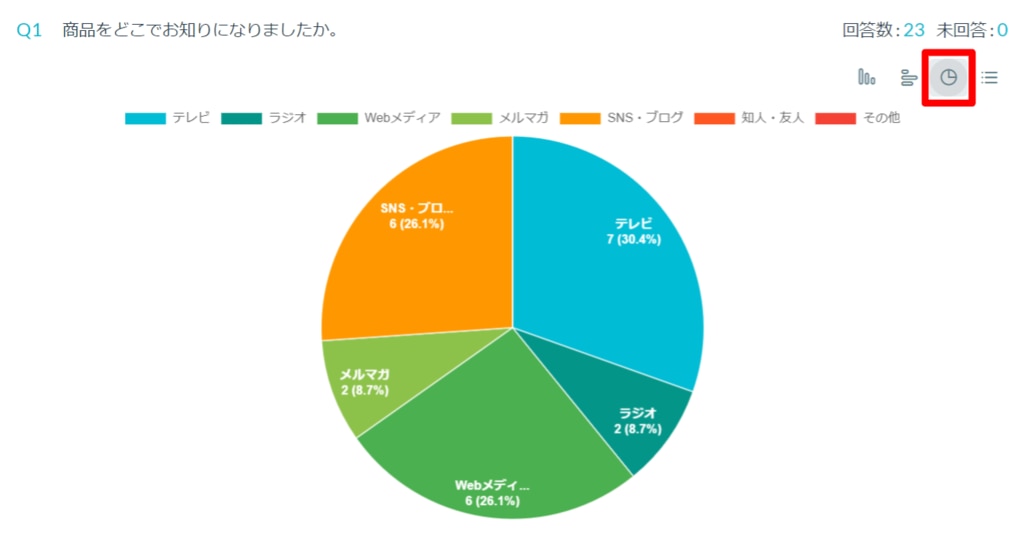
For the pie chart, the specifications are to display the number of submissions and the percentage for each selection field.
Note that labels with a percentage less than 3% are not displayed.
About the list:
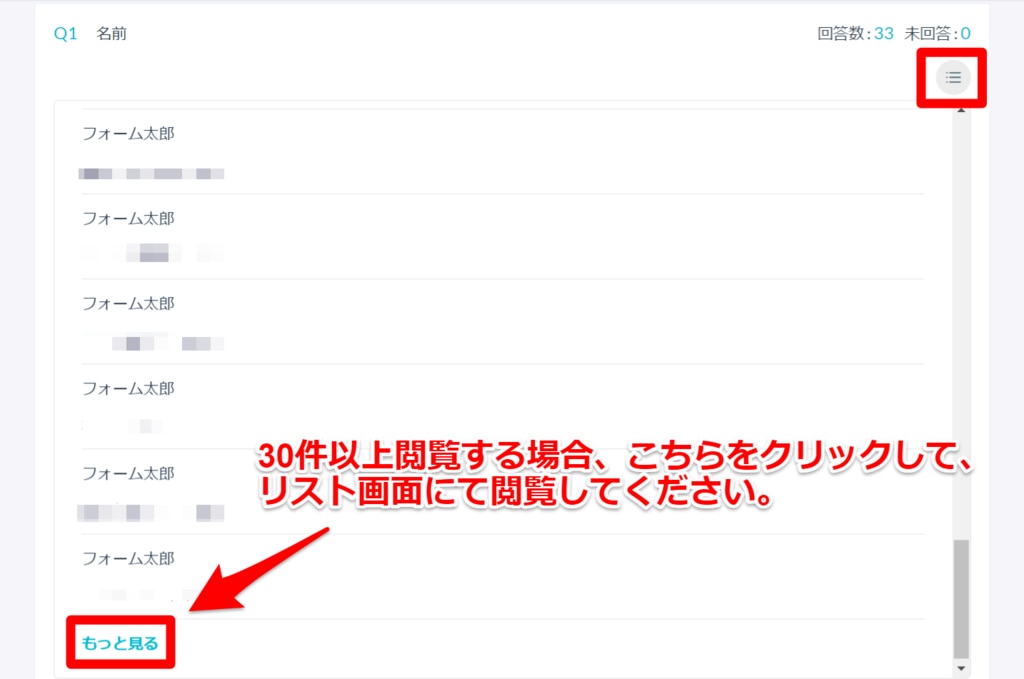
In the list,
- It displays an overview of fields where text is entered (like the "email address" field, "numeric" field, etc.)
- By default, it displays 30 fields, and to view more, click on "see more" and view it on the list page
These are the specifications.